
Knowing the average alcohol consumption in the US is essential for public health, policy, and cultural reasons. Over the past several decades, Americans have significantly changed the way they drink alcohol. As per data from a new survey, nowadays Americans drink far less than they used to in the past.
In this article, we explore U.S. alcohol consumption statistics, U.S. drinking trends, demographic breakdowns, and health-related data by analyzing the most recent publicly available surveys and reports.
What does “Average Alcohol Consumption” mean?
Average alcohol consumption is defined as the amount of pure alcohol consumed annually by each person. This quantification helps make it easier to compare trends over time in a particular region or country. This value is measured in gallons, or “standard drinks.” [1]
A standard drink is one that contains approximately 0.6 fluid ounces of alcohol. This can be roughly equivalent to a 12-ounce beer, a 5-ounce glass of wine, or 1.5 ounces of distilled spirits. [2]
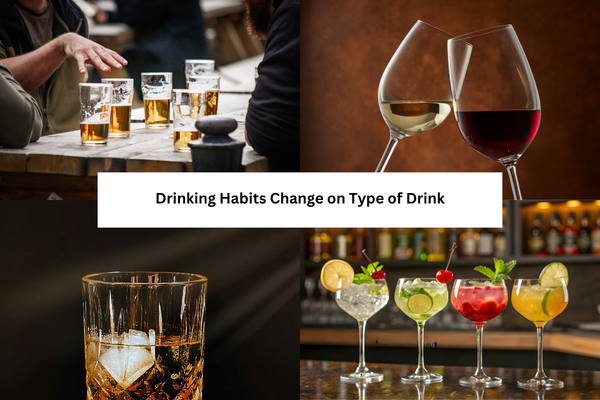
How Consumption Changes Over Time: National Trends
Several studies on alcohol consumption and trends are ongoing. Most of these patterns appear to be cultural and behavioral rather than related to the country’s economy.
According to the National Institute on Alcohol Abuse and Alcoholism (NIAAA), the amount of alcohol consumed by each individual in the United States has fluctuated over time. The most recent year with all available data is 2022. In 2022, the average person consumed approximately 2.50 gallons of ethanol. This amount is slightly less than in the previous years, such as 2021.
Historical Context
In the early 1980s, the average amount of alcohol consumed by each person in the United States was at its peak, at approximately 3.28 gallons per adult per year. It then declined in the late 1990s before rising again in the early 2000s.
This long-term perspective demonstrates that, despite the fact that the trend has shifted dramatically in recent years, factors such as generations, health messages, and larger societal changes can still influence outcomes.
A Major Shift in the 2025 Survey Data
A Gallup poll in 2025 showed that alcohol use in the U.S. has undergone many changes over the last few years. [3] The findings indicated:
- At 54%, the proportion of American adults who reported drinking alcohol is at its lowest level since Gallup started monitoring this behavior in 1939.
- This indicates that fewer adults are drinking than the 58% in 2024 and the 62% in 2023.
- The average number of drinks consumed during the past week was 2.8, the lowest since 1996.
- Just 24% of drinkers reported having an alcoholic beverage within the previous 24 hours, which is another low percentage.
Younger people, especially those under 35, drink less than older people.
Why do people in the US drink less?
There are a few things that might be making this change happen:
- More people are aware of the health risks of drinking alcohol, and most Americans say that even moderate drinking can be bad for you.
- Economic pressures, like inflation and changes in the cost of living.
- Younger generations have different priorities over older generations on what they spend their money on.
Even though research is still going on, these patterns seem to be more about culture and behavior than just economics.
Demographics of U.S. Drinking
Different groups drink alcohol in different ways:
- Age: Young adults are more likely than older people to drink less. In some recent surveys, only about half of adults between the ages of 18 and 35 said they drank, which is a big drop from previous generations.
- Gender: In the past, men drank more often than women, but the gaps have gotten smaller and the patterns change with age and location. [4]
- Health Perceptions: People who think alcohol is dangerous or bad for their health are less likely to drink often.
Drinking Too Much and Public Health
Even though overall drinking is decreasing, binge and heavy drinking remain public health issues in the United States.
The CDC states that in the United States:
- Approximately 17% of people binge drink, which is defined as having four or more drinks for women and five or more drinks for men at once.
- About 6% of people drink excessively, which means women have 8 or more drinks per week and men have 15 or more.
Excessive consumption is associated with increased health risks and social costs, accounting for a significant portion of alcohol-related deaths.
Key Takeaways: U.S. Drinking Habits in 2025
Recent data show the following:
- Overall, per capita alcohol use remains high, but it is not increasing rapidly.
- Today, more adults say they don’t drink alcohol than at any point since the 1950s.
- In comparison to previous years, drinkers consume less alcohol on a weekly basis.
- Patterns vary greatly from state to state, demonstrating how geography and policy influence habits.
- Even though overall alcohol consumption is declining, excessive drinking remains a health concern.
Final Thoughts
People in the United States continue to drink alcohol in new ways. Long-term per-capita statistics show highs and lows in the past, but a new trend is emerging in 2025: fewer adults are drinking at all. This transformation coincides with ongoing public health messages about the dangers of alcohol. It’s unclear whether these trends will continue, but the data we have now indicates a significant shift in how Americans feel about drinking.
These statistics provide insight into how alcohol is consumed in modern America for those interested in public health, social trends, or policy.
If you need help with alcohol addiction, be sure to get in contact with an expert.
References
| ↑1 | Apparent Per Capita Alcohol Consumption: National, State, And Regional Trends, 1977–2022. Megan E. Slater, Ph.D. Hillel R. Alpert, Sc.D. |
|---|---|
| ↑2 | 10 facts about Americans and alcohol as ‘Dry January’ begins. Katherine Schaeffer and Drew DeSilver |
| ↑3 | Gallup: U.S. Drinking Rate at New Low as Alcohol Concerns Surge |
| ↑4 | CDC: Data on Excessive Alcohol Use |