Drug Helpline has released a new report on the states in the US that drink the most alcohol. The report identifies the states that drink the most beer, the most alcohol by volume, and those with the highest number of alcohol-related driving deaths. It also identifies the five states that drink the least alcohol.
Drug Helpline invites those struggling with alcohol addiction to call its 24/7 alcohol hotline on (844) 289-0879.
Drinking alcohol is a quintessential part of celebrations in many parts of the world, including the United States. It is a common practice to make a toast with a glass of champagne to mark special occasions or celebrate accomplishments. Other reasons people consume alcohol include for relaxation, socializing, and to escape problems.
However, excessive alcohol use can have serious consequences. Drinking too much can lead to accidents and injuries on account of impaired judgment, slowed reaction times, difficulty concentrating, and lack of coordination. Heavy drinking is also linked to many serious health problems, such as liver cirrhosis, heart disease, digestive conditions, poor immunity, certain types of cancer, memory problems, depression and anxiety. In fact, alcohol contributes to more than 200 diseases and conditions. Moreover, excessive alcohol use can lead to social problems such as unemployment and strained relationships. For these reasons, it is important to drink in moderation.
Where you live can have a bearing on how much you drink. Some states in the United States are doing better than others in terms of alcohol consumption and alcohol-related problems. Please keep reading to find out which states drink the most alcohol in America.
Alcohol Consumption in the United States
Before we delve into state-wise statistics, let us quickly look at overall alcohol consumption in the US.
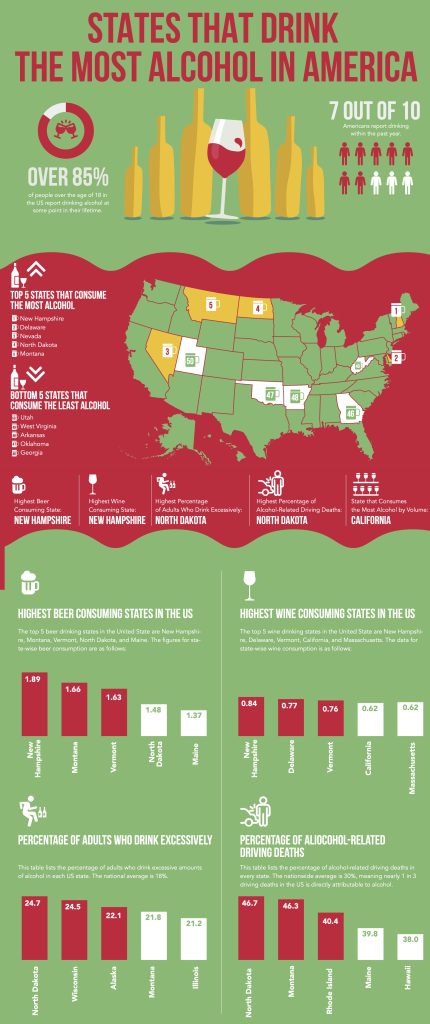
- Over 85% of people over the age of 18 in the US report drinking alcohol at some point in their lifetime.
- 7 out of 10 Americans report drinking within the past year.
- Over half of all men and women report drinking alcohol in the past month.
Binge Drinking
Not only is alcohol consumption popular in the US, but unhealthy alcohol consumption habits are prevalent. The National Survey on Drug Use and Health (NSDUH) has found that approximately 1 in 4 people over the age of 18 in the US report binge drinking in the past month (men more than women). Binge drinking is consuming a large amount of alcohol (5 or more drinks for men and 4 or more drinks for women) on one occasion or in a short amount of time. People who indulge in high-intensity drinking (twice the gender-specific binge drinking threshold) have a 70 times greater risk of needing alcohol-related emergency healthcare.
Alcohol Use Disorder
Given the above statistics, it is not surprising that nearly 15 million Americans suffer from alcohol use disorder (also called alcoholism or alcohol addiction). AUD is an inability to stop or control alcohol use despite health, social, and occupational consequences. What’s worrying is that less than 10% of people with alcohol use disorder receive the necessary treatment for this serious condition. Also, 1 in 10 children in the US aged 17 years and younger live with a parent who has alcohol use disorder.
Alcohol-Related Emergencies and Deaths
Alcohol is responsible for nearly 1 in 5 emergency department visits. More than 140,000 men and women die from alcohol-related causes each year. This makes alcohol the fourth leading preventable cause of death in the US. Close to one-third of all driving fatalities in the country are attributed to alcohol-impaired driving.
The Economic Burden of Alcohol Use Disorder
The misuse of alcohol costs the US $249 billion each year (2010 data). Three quarters of this cost is on account of binge drinking.
Per Capital Alcohol Consumption in the US
Americans drink nearly 8 billion gallons of alcohol a year. According to the National Institute on Alcohol Abuse and Alcoholism (NIAAA), the per capital alcohol consumption in the US in 2018 was 2.35 gallons or approximately 500 drinks per person per year. The Healthy People 2020 program has set a national target of per capita alcohol consumption at no more than 2.1 gallons per person per year. Alcohol consumption peaked in the 1980s at around 2.75 gallons per capita. It fell subsequently but has been trending up again since the 1990s.
Top 5 States That Consume the Most Alcohol
- New Hampshire
- Delaware
- Nevada
- North Dakota
- Montana
Bottom 5 States That Consume the Least Alcohol
- Utah
- West Virginia
- Arkansas
- Oklahoma
- Georgia
Highest Beer Consuming State: New Hampshire
Highest Wine Consuming State: New Hampshire
Highest Percentage of Adults Who Drink Excessively: North Dakota
Highest Percentage of Alcohol-Related Driving Deaths: North Dakota
State that Consumes the Most Alcohol by Volume: California
Factors Affecting Alcohol Consumption in US States
Surveys have found that geographical location can play a vital role in alcohol consumption, excessive alcohol intake, and alcohol-related driving deaths. Some of the key findings of various research initiatives are briefly described below.
Median Household Income and Excessive Alcohol Use
Drinking alcohol is an expensive practice. As a result, states with low-income populations have lower rates of excessive drinking. For example, Tennessee and West Virginia, which have some of the lowest rates of excessive drinking in the country also have a median household income of $58,516 (Tennessee) and $50,884 (West Virginia) which is well below the national average of $70,784.
On the other hand, states with a high median household income, such as New Jersey ($89,703) and Massachusetts ($89,206) feature among the top wine consuming states in the US.
However, some states like Maryland are the exception where excessive drinking rates are low (15.5% versus a national average of 18%) despite a high median household income ($91,431 versus a national average of $70,784).
Alcohol Consumption and Religion
Faith and religion play an important role in a state’s consumption of alcohol. For instance, the low drinking rates in Utah can be attributed to half the state’s population being Mormon, a faith that prohibits alcohol. In line with low alcohol use rates, the percentage of driving deaths attributable to alcohol in Utah are the lowest in the country at 19.7%, compared to the national average of 30%.
Alcohol Use and Health
The links between alcohol use and poor health are well established. However, unexpectedly, states with lower drinking rates also have the largest percentage of adults in poor health. This can be explained by the fact that besides excessive drinking, health depends on many other factors, such as physical inactivity, obesity, smoking, income and poverty rates.
Not surprisingly, Mississippi, which has the lowest median household income among all US states ($49,111) and a high poverty rate also has the third highest percentage (22.2%) of adults in poor health. In some states, for example, Kentucky, excessive drinking rates are relatively low (16.3%) but more than 1 in 5 adults are in poor health, likely due to factors such as low income, smoking, and obesity.
On the other hand, in states like Virginia, New Jersey, and California that have an above-average median household income and low poverty rates, the percentage of adults in good health is high. This can be explained by higher incomes, better access to healthcare, and healthier lifestyles. In Colorado, 19.1% of adults report excessive drinking, which is higher than the national average of 18%. Despite this, people in Colorado are healthier than most Americans, likely due to low obesity and low physical inactivity rates.
Excessive Drinking and Premature Death
States that have low rates of heavy drinking tend to have lower rates of premature deaths before the age of 75. For example, 15.4% of adults report excessive drinking in Idaho, which is below the national average of 18%. Corresponding to this, Idaho enjoys a lower rate of premature deaths (310 per 100,000) compared to the national average of 333.
But some states defy this trend. For example, in Nevada, the excessive drinking rate is relatively low (15.8%) but the premature death rate is relatively high (360 per 100,000) likely due to factors other than alcohol consumption. Similarly, in Delaware, the excessive drinking rate is relatively low at 16.8% but the rate of premature deaths is higher than the national average at 387 per 100,000 versus 333 for the nation as a whole.
Alcohol Consumption and Driving Fatalities
Generally speaking, high rates of alcohol consumption are linked to a higher percentage of driving fatalities attributed to alcohol. For example, in North Dakota, 24.7% of adults report binge drinking or heavy drinking, the highest in the country. Corresponding to this, 46.7% of driving fatalities in the state are attributed to alcohol, compared to a national average of 30%. Similarly, in Maine, high rates of heavy drinking (19.6%) correspond to high alcohol-related car accidents (nearly 40%). In contrast, in states like New York with average heavy alcohol use (18%), alcohol-related roadway fatalities are some of the lowest in the country (23%).
However, some states are the exception. In Delaware, alcohol-related traffic fatalities are high (37.9%) despite a low rate of excessive alcohol use (16.6%). This may be because there is no mandatory jail time for a first time DUI offence in Delaware. While courts can put first time offenders in jail for 12 months, they mostly suspend a jail sentence in lieu of a year of probation and $500 to $1500 in fines.
Alcohol Consumption and Risky Sexual Behaviors
Excessive alcohol intake is linked to risky sexual behaviors, which can lead to unwanted pregnancies and sexually transmitted infections. States such as Idaho that have low rates of excessive alcohol use also have low rates of sexually transmitted diseases. The Centers for Disease Control and Prevention (CDC) says chlamydia diagnoses in Idaho are 337 per 100,000 population which is well below the US national average of 456.
Alcohol and Mental Health
Drinking too much alcohol has been linked to mental health problems like depression and anxiety. States with low excessive drinking rates, such as Maryland, also have a lower-than-average rate of mentally unhealthy days (3.4 days per month in Maryland versus 3.7 for the national average).
Alcohol Use and State Alcohol Taxes
Some states impose higher excise taxes (state taxes on beer, wine, and distilled spirits) as a policy and practice solution to reduce alcohol consumption. Other measures include having commercial host (dram shop) liability laws and regulating the density of alcohol outlets. Scientific evidence supports that these measures are effective. For example, New Hampshire, which is the highest beer consuming state in the US, has some of the lowest state beer taxes ($0.30 per gallon of beer).
The cost of alcohol may not be a factor in high-income states, however. For example, in Alaska which has a median household income of $80,287, well above the national average, excessive drinking rates are high at 22.1% (national average 18%) despite the high cost of alcohol in the state. A fifth (750 mL) of Jack Daniels in Alaska is $35 compared to $15.99 in New Mexico and in the $20-$29 range in most states.
Alcohol Use in Rural vs Urban Areas
The US Census Bureau defines urban areas as those with a population of 50,000 people or more, urban clusters as areas with a population of 2,500 to 49,000 people, and rural areas as those areas that do not qualify as urban or urban clusters. Living in an urban versus rural area can increase the risk of alcohol consumption and alcohol-related problems due to cultural differences (acceptable drinking behaviors), greater availability of alcohol, younger demographics, and economic factors like more disposable income.
Surveys have found that alcohol use is highest in large and small metropolitan areas at nearly 73% and 70%, respectively, compared to 61% in non-metro areas and 58% in rural areas in the US. Correspondingly, the rates of alcohol use disorder have been found to be 7.4% in large and small metro areas and 6.1% in non-metropolitan areas.
Alcohol Use and Race and Religion
The demographics of a state (the race or ethnicity of most of the population) can affect alcohol consumption patterns. American Indians and Alaskans have some of the highest rates of binge drinking and heavy alcohol use. They are also the most affected by alcohol problems. Asian Americans have the lowest rates of heavy alcohol use and are the least affected by alcohol-related problems. The differences based on race among Hispanics, Blacks, and Whites are more nuanced. Rural residence is protective against alcohol use for both Blacks and Whites with abstinence rates of around 65-66%. However, in urban areas, Blacks have higher abstinence rates (63%) compared to Whites (50%).
Religion is an important factor in predicting drinking rates in a region. Regions that have a predominance of Catholics typically have higher alcohol consumption than regions where most of the population is Evangelical Protestant.
Highest Alcohol Consuming Regions in the US
Every geographical region in the US has unique alcohol consumption habits related to the drinking culture with corresponding alcohol-related problems. Some of the factors that affect a region’s alcohol consumption include demographics (age, gender, ethnicity), education and income levels, religion, urban versus rural populations, alcohol policies and regulations, state taxes on alcohol, the structure of the alcohol distribution market in the region, cultural factors, media promotions, and more.
In the 1960s, the Northeast, North Central, and Pacific regions were “wet,” i.e., they had higher per capita consumption of alcohol. In contrast, the South, Mountain, and North Western states were “dry” with lower rates of alcohol consumption. In the 1970s and 80s, these “drier” regions became “wetter” but the difference remained.
In the 2000s:
Wet regions include:
North Central: Alaska, Colorado, Iowa, Illinois, Michigan, Missouri, Minnesota, Montana, Ohio, Nebraska, North Dakota, South Dakota, Wisconsin, Wyoming.
New England: Maine, Massachusetts, New Hampshire, Vermont, Rhode Island.
Wet-dry (moderate) regions include:
Mid-Atlantic: Connecticut, Maryland, Delaware, New York, New Jersey, Pennsylvania.
Pacific: Hawaii, California, Nevada, Idaho, Washington, Oregon.
Southern Coastal: Florida, Louisiana, Arizona, South Carolina, Texas, New Mexico.
Dry regions include:
South: Arkansas, Alabama, Indiana, Kentucky, Georgia, North Carolina, Mississippi, Tennessee, Oklahoma, Virginia, West Virginia, Utah.
States That Consume the Most Alcohol by Volume
When it comes to alcohol consumption by volume, California tops the table at 85.7 million gallons of alcohol consumed by Californians per year (2020 data). Other states in the top 5 include Texas (56.9 million gallons per year), Florida (50.4 million gallons per year), New York (36 million gallons per year), and Illinois (25.3 million gallons per year). The lowest alcohol consuming states by volume are Wyoming (1.4 million gallons per year), Alaska (1.6 million gallons per year), South Dakota (1.6 million gallons per year), Vermont (1.7 million gallons per year) and North Dakota (2 million gallons per year).
Highest Alcohol Consuming States in the US Per Capita
This table lists the average amount of alcohol consumed per person in a year by state:
| State | Average alcohol consumption in gallons per person per year | Rank |
| New Hampshire | 4.67 | 1 |
| Delaware | 3.52 | 2 |
| Nevada | 3.42 | 3 |
| North Dakota | 3.16 | 4 |
| Montana | 3.10 | 5 |
| Vermont | 3.06 | 6 |
| Idaho | 2.94 | 7 |
| Wisconsin | 2.93 | 8 |
| Colorado | 2.88 | 9 |
| Alaska | 2.85 | 10 |
| Maine | 2.85 | 10 |
| Minnesota | 2.79 | 12 |
| Wyoming | 2.78 | 13 |
| Oregon | 2.74 | 14 |
| Hawaii | 2.66 | 15 |
| Rhode Island | 2.63 | 16 |
| Florida | 2.61 | 17 |
| Massachusetts | 2.55 | 18 |
| Louisiana | 2.55 | 18 |
| Missouri | 2.51 | 20 |
| California | 2.49 | 21 |
| Connecticut | 2.40 | 22 |
| Iowa | 2.39 | 23 |
| Illinois | 2.39 | 24 |
| South Dakota | 2.37 | 25 |
| New Jersey | 2.36 | 26 |
| Michigan | 2.36 | 26 |
| Pennsylvania | 2.34 | 28 |
| New Mexico | 2.24 | 29 |
| Texas | 2.26 | 30 |
| Arizona | 2.25 | 31 |
| Washington | 2.22 | 32 |
| New York | 2.21 | 33 |
| North Carolina | 2.17 | 34 |
| Mississippi | 2.17 | 34 |
| South Carolina | 2.16 | 36 |
| Nebraska | 2.16 | 36 |
| Indiana | 2.15 | 38 |
| Tennessee | 2.14 | 39 |
| Virginia | 2.13 | 40 |
| Maryland | 2.08 | 41 |
| Ohio | 2.03 | 42 |
| Alabama | 1.99 | 43 |
| Kentucky | 1.95 | 44 |
| Kansas | 1.92 | 45 |
| Georgia | 1.90 | 46 |
| Oklahoma | 1.85 | 47 |
| Arkansas | 1.78 | 48 |
| West Virginia | 1.74 | 49 |
| Utah | 1.35 | 50 |
Highest Beer Consuming States in the US
The top 5 beer drinking states in the United State are New Hampshire, Montana, Vermont, North Dakota, and Maine. The figures for state-wise beer consumption are as follows:
| State | Beer consumption per capita in gallons per year | Rank |
| New Hampshire | 1.89 | 1 |
| Montana | 1.66 | 2 |
| Vermont | 1.63 | 3 |
| North Dakota | 1.48 | 4 |
| Maine | 1.37 | 5 |
| South Dakota | 1.34 | 6 |
| Pennsylvania | 1.33 | 7 |
| Nevada | 1.32 | 8 |
| Hawaii | 1.28 | 9 |
| Wisconsin | 1.27 | 10 |
| Iowa | 1.26 | 11 |
| Texas | 1.25 | 12 |
| Louisiana | 1.24 | 13 |
| New Mexico | 1.20 | 14 |
| Wyoming | 1.20 | 14 |
| Mississippi | 1.19 | 16 |
| Nebraska | 1.19 | 16 |
| West Virginia | 1.14 | 18 |
| Colorado | 1.13 | 19 |
| Oregon | 1.13 | 19 |
| Delaware | 1.12 | 21 |
| Minnesota | 1.11 | 22 |
| Ohio | 1.11 | 22 |
| Missouri | 1.09 | 24 |
| Kansas | 1.08 | 25 |
| California | 1.07 | 26 |
| North Carolina | 1.06 | 27 |
| South Carolina | 1.06 | 27 |
| Arizona | 1.05 | 29 |
| Illinois | 1.05 | 29 |
| Alabama | 1.04 | 31 |
| Florida | 1.03 | 32 |
| Alaska | 1.02 | 33 |
| Michigan | 1.00 | 34 |
| Oklahoma | 0.98 | 35 |
| Tennessee | 0.97 | 36 |
| Virginia | 0.96 | 37 |
| Indiana | 0.94 | 38 |
| Georgia | 0.93 | 39 |
| Arkansas | 0.91 | 40 |
| Kentucky | 0.91 | 40 |
| Washington | 0.88 | 42 |
| Massachusetts | 0.85 | 43 |
| New York | 0.84 | 44 |
| Idaho | 0.83 | 45 |
| New Jersey | 0.82 | 46 |
| Rhode Island | 0.82 | 47 |
| Connecticut | 0.79 | 48 |
| Maryland | 0.77 | 49 |
| Utah | 0.55 | 50 |
Highest Wine Consuming States in the US
The top 5 wine drinking states in the United State are New Hampshire, Delaware, Vermont, California, and Massachusetts. The data for state-wise wine consumption is as follows:
| State | Wine consumption per capita in gallons per year | Rank |
| New Hampshire | 0.84 | 1 |
| Delaware | 0.77 | 2 |
| Vermont | 0.76 | 3 |
| California | 0.62 | 4 |
| Massachusetts | 0.62 | 4 |
| New Jersey | 0.61 | 6 |
| Connecticut | 0.60 | 7 |
| Hawaii | 0.60 | 7 |
| Nevada | 0.59 | 9 |
| Florida | 0.56 | 10 |
| Rhode Island | 0.55 | 11 |
| Montana | 0.54 | 12 |
| Oregon | 0.54 | 12 |
| Virginia | 0.53 | 14 |
| Alaska | 0.51 | 15 |
| Colorado | 0.51 | 16 |
| New York | 0.51 | 16 |
| Washington | 0.51 | 16 |
| Illinois | 0.47 | 19 |
| North Carolina | 0.47 | 19 |
| Maine | 0.44 | 21 |
| Minnesota | 0.44 | 21 |
| Michigan | 0.42 | 23 |
| Wisconsin | 0.42 | 23 |
| Maryland | 0.40 | 25 |
| Missouri | 0.39 | 26 |
| Arizona | 0.38 | 27 |
| Tennessee | 0.35 | 28 |
| Texas | 0.35 | 28 |
| Indiana | 0.34 | 30 |
| Louisiana | 0.34 | 30 |
| North Dakota | 0.33 | 32 |
| Wyoming | 0.33 | 32 |
| Idaho | 0.32 | 34 |
| Pennsylvania | 0.32 | 34 |
| New Mexico | 0.31 | 36 |
| Ohio | 0.31 | 36 |
| Arkansas | 0.26 | 38 |
| Alabama | 0.25 | 39 |
| Georgia | 0.25 | 39 |
| Kentucky | 0.24 | 41 |
| South Carolina | 0.24 | 41 |
| Iowa | 0.23 | 43 |
| Mississippi | 0.22 | 44 |
| Nebraska | 0.22 | 44 |
| South Dakota | 0.22 | 44 |
| Utah | 0.20 | 47 |
| Oklahoma | 0.19 | 48 |
| Kansas | 0.14 | 49 |
| West Virginia | 0.11 | 50 |
Percentage of Adults Who Drink Excessively
This table lists the percentage of adults who drink excessive amounts of alcohol in each US state. The national average is 18%.
| State | Percentage of Adults Drinking Excessively | Rank |
| North Dakota | 24.7 | 1 |
| Wisconsin | 24.5 | 2 |
| Alaska | 22.1 | 3 |
| Montana | 21.8 | 4 |
| Illinois | 21.2 | 5 |
| Minnesota | 21.1 | 6 |
| Iowa | 21.0 | 7 |
| Hawaii | 20.5 | 8 |
| Nebraska | 20.4 | 9 |
| Michigan | 20.0 | 10 |
| Maine | 19.6 | 11 |
| Vermont | 19.6 | 11 |
| Massachusetts | 19.5 | 13 |
| Ohio | 19.2 | 14 |
| Colorado | 19.1 | 15 |
| Oregon | 18.8 | 16 |
| Louisiana | 18.8 | 16 |
| Connecticut | 18.6 | 18 |
| New Hampshire | 18.4 | 19 |
| New York | 18.2 | 20 |
| Pennsylvania | 18.1 | 21 |
| California | 18.0 | 22 |
| Rhode Island | 17.9 | 23 |
| Washington | 17.8 | 24 |
| South Dakota | 17.7 | 25 |
| Missouri | 17.7 | 25 |
| New Jersey | 17.6 | 27 |
| Wyoming | 17.5 | 28 |
| Florida | 17.4 | 29 |
| Virginia | 17.4 | 29 |
| Texas | 17.3 | 31 |
| Kansas | 16.9 | 32 |
| Georgia | 16.8 | 33 |
| Indiana | 16.8 | 33 |
| Delaware | 16.6 | 35 |
| South Carolina | 16.6 | 35 |
| Kentucky | 16.3 | 37 |
| Arizona | 16.0 | 38 |
| Nevada | 15.8 | 39 |
| Maryland | 15.5 | 40 |
| Idaho | 15.4 | 41 |
| Arkansas | 15.3 | 42 |
| North Carolina | 14.9 | 43 |
| Oklahoma | 13.9 | 44 |
| New Mexico | 13.8 | 45 |
| Mississippi | 13.3 | 46 |
| Alabama | 13.0 | 47 |
| Utah | 12.4 | 48 |
| West Virginia | 11.4 | 49 |
| Tennessee | 11.2 | 50 |
Percentage of Alcohol-Related Driving Deaths
This table lists the percentage of alcohol-related driving deaths in every state. The nationwide average is 30%, meaning nearly 1 in 3 driving deaths in the US is directly attributable to alcohol.
| State | Percentage of Alcohol-Related Driving Deaths | Rank |
| North Dakota | 46.7 | 1 |
| Montana | 46.3 | 2 |
| Rhode Island | 40.4 | 3 |
| Maine | 39.8 | 4 |
| Hawaii | 38.0 | 5 |
| Delaware | 37.9 | 6 |
| South Carolina | 37.8 | 7 |
| Wisconsin | 36.9 | 8 |
| Nebraska | 35.6 | 9 |
| Wyoming | 35.3 | 10 |
| South Dakota | 35.2 | 11 |
| Washington | 35.0 | 12 |
| Colorado | 34.7 | 13 |
| Ohio | 34.3 | 14 |
| Illinois | 34.2 | 15 |
| Alaska | 33.8 | 16 |
| Vermont | 33.4 | 17 |
| Connecticut | 33.4 | 17 |
| Oregon | 32.8 | 19 |
| Maryland | 32.8 | 19 |
| Nevada | 32.8 | 19 |
| Louisiana | 32.6 | 22 |
| Idaho | 32.4 | 23 |
| North Carolina | 32.3 | 24 |
| New Mexico | 32.1 | 25 |
| West Virginia | 32.0 | 26 |
| Pennsylvania | 32.0 | 26 |
| Missouri | 31.7 | 28 |
| New Hampshire | 31.2 | 29 |
| Minnesota | 30.9 | 30 |
| Virginia | 30.5 | 31 |
| Oklahoma | 29.9 | 32 |
| Texas | 29.9 | 32 |
| Alabama | 29.4 | 34 |
| Michigan | 29.4 | 34 |
| California | 29.0 | 36 |
| Kentucky | 28.5 | 37 |
| Arkansas | 28.4 | 38 |
| Florida | 28.2 | 39 |
| Tennessee | 28.0 | 40 |
| Massachusetts | 27.8 | 41 |
| Arizona | 27.6 | 42 |
| Kansas | 27.3 | 43 |
| Iowa | 25.4 | 44 |
| New Jersey | 24.3 | 45 |
| Indiana | 23.6 | 46 |
| Georgia | 23.4 | 47 |
| Mississippi | 23.3 | 48 |
| New York | 23.0 | 49 |
| Utah | 19.7 | 50 |
Last updated: May 12, 2025